
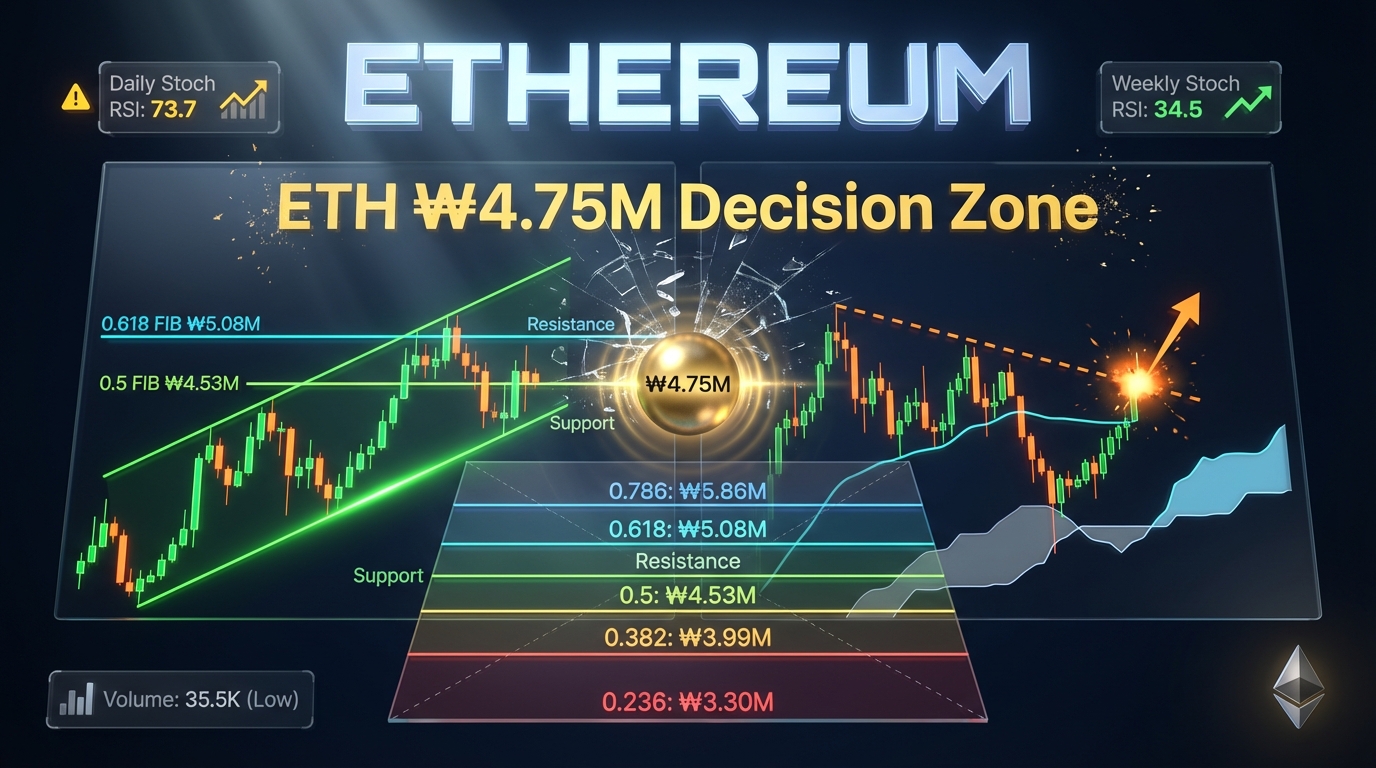

- 이더리움은 2025년 하반기 고점(684만원) 이후 조정을 거쳐 220만원 저점을 기록한 뒤, 현재 475만원 부근에서 거래되고 있으며 주봉 피보나치 0.5(453만원)와 0.618(507만원) 사이에 위치해 있다.
- 일봉 차트에서는 하락 채널 상단을 돌파하고 일목 구름 위로 복귀했으나, Stoch RSI가 73.7로 과열 구간 진입 직전이며 거래량은 35.5K로 에너지 축적 단계에 있다.
- 주봉 차트에서는 상승 채널 하단~중단 사이로 복귀하며 Stoch RSI가 34.5에서 상승 전환 신호를 보이고 있으나, 거래량은 아직 폭발적 증가 없이 관망 국면이 이어지고 있다.
인트로 — 이더리움(ETH)이란?
이더리움(Ethereum)은 2015년 비탈릭 부테린(Vitalik Buterin)이 개발한 블록체인 플랫폼으로, 스마트 계약(Smart Contract) 기능을 지원하는 세계 최초의 범용 블록체인이다. 비트코인이 “디지털 금”으로 자리매김했다면, 이더리움은 “디지털 경제의 운영 체제”로 평가받으며 DeFi(탈중앙화 금융), NFT(대체 불가능 토큰), 메타버스 등 다양한 애플리케이션의 기반이 되고 있다.
이더리움(ETH) 핵심 특징
- (1) 스마트 계약 플랫폼: 중개자 없이 코드로 자동 실행되는 계약 기능을 지원하며, DeFi·NFT·DAO 등 다양한 생태계의 기반이 된다.
- (2) PoS 전환 완료(The Merge): 2022년 9월 PoW(작업증명)에서 PoS(지분증명)로 전환하며 에너지 소비를 99.95% 감소시켰다.
- (3) 레이어2 확장성: Optimism, Arbitrum, zkSync 등 레이어2 솔루션을 통해 거래 속도를 높이고 수수료를 낮추는 방향으로 발전하고 있다.
이더리움은 2021년 11월 사상최고가(약 570만원, USD $4,891 기준)를 기록한 이후 2022년 약세장을 거쳐 2023년 하반기부터 회복세를 보였다. 2025년 중반 한국 시장에서 684만원 고점을 기록한 뒤 조정을 거쳐 220만원 저점까지 하락했으나, 현재는 475만원 부근에서 방향성을 모색하고 있다.
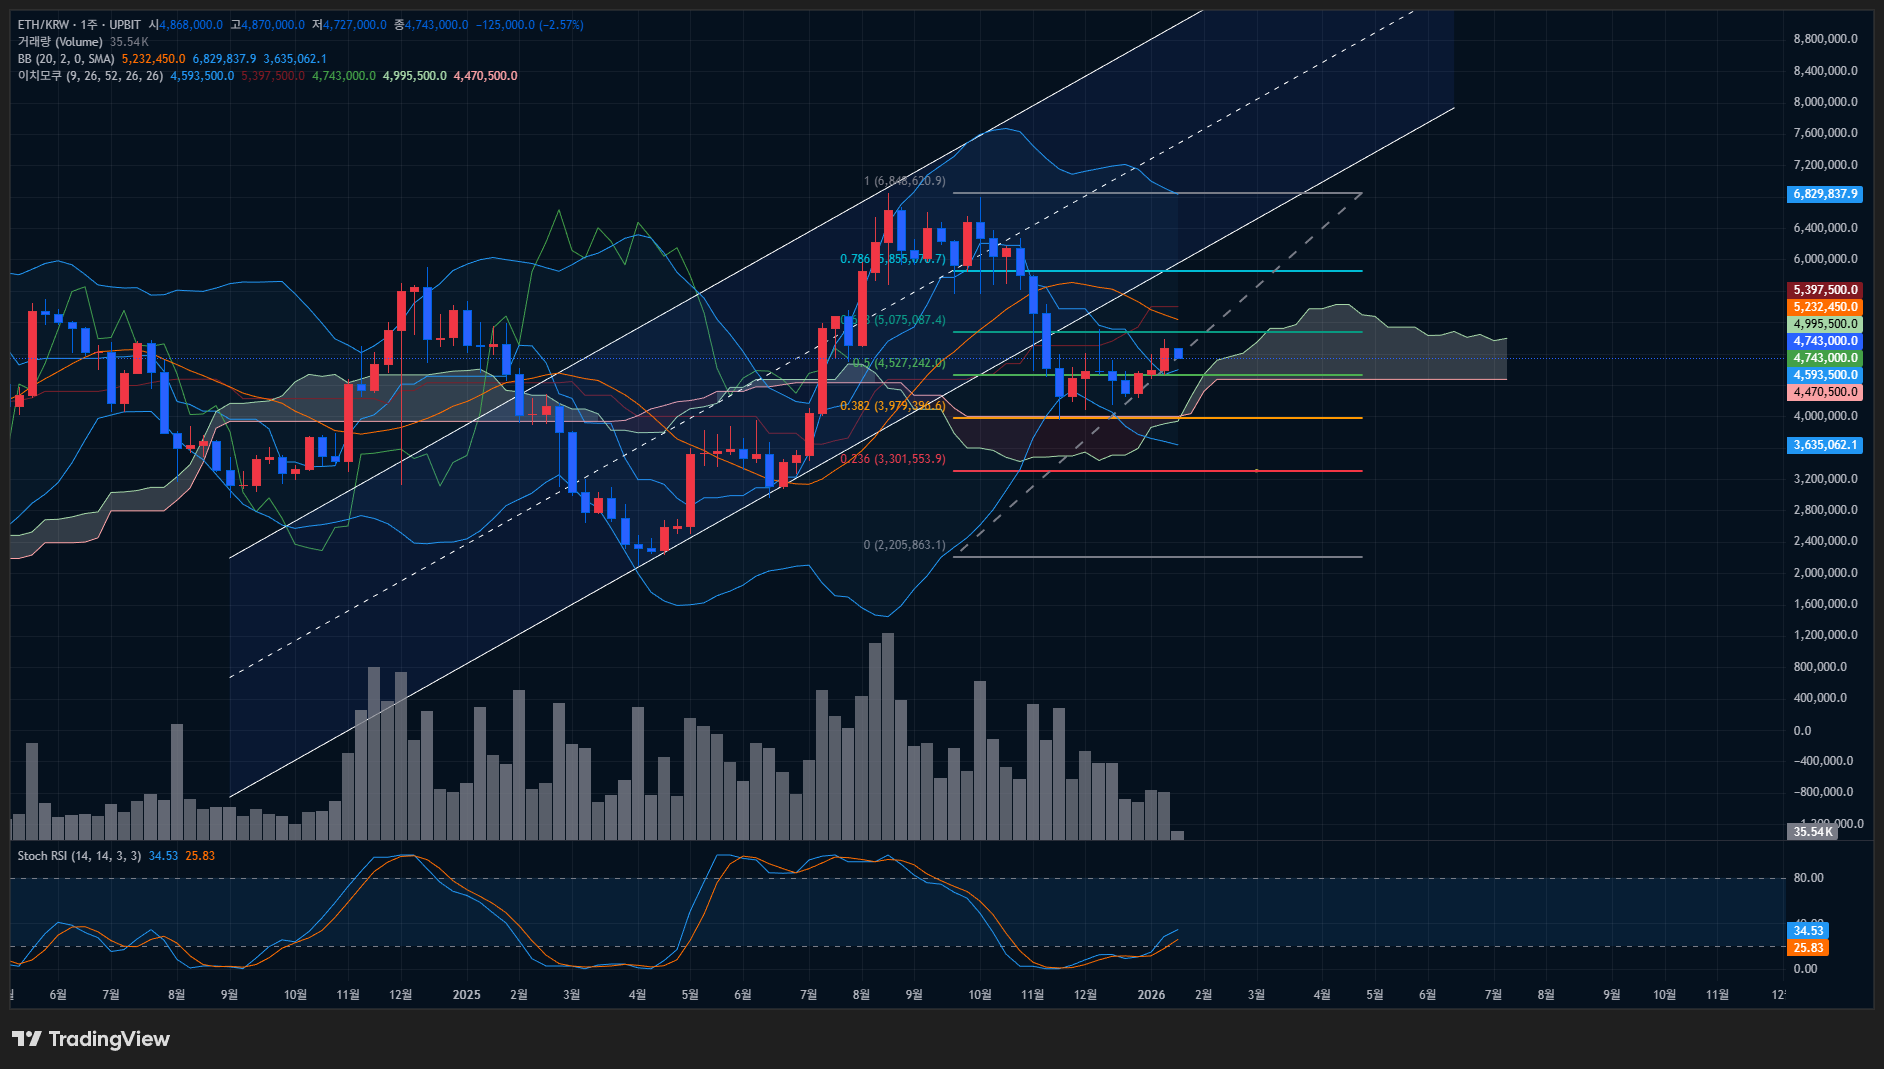
출처: 업비트 주봉챠트 ( 26.01.20)
주봉 기술적 분석: 상승 채널 하단 복귀, 피보나치 0.5~0.618 사이
주봉 차트(2025년~2026년 1월)를 보면, 이더리움은 2025년 저점(220만원)에서 시작된 우상향 채널 하단을 한 번 이탈했다가 다시 채널 하단~중단 사이로 복귀한 상태다. 현재 주봉 종가는 약 475만원으로, 피보나치 0.5(453만원)와 0.618(507만원) 사이에 위치해 있어 중단기 방향성의 분기점에 놓여 있다.
주봉 주요 지표 (2026년 1월 20일 기준)
- 현재가: 약 4,75만원
- 최근 고점: 6,846,320원 (684만원)
- 최근 저점: 2,205,863원 (220만원)
- 피보나치 리트레이스먼트 (저점 220만원 → 고점 684만원 기준):
- – 0.236: 약 330만원 (붉은 선)
- – 0.382: 약 399만원 (주황 선)
- – 0.5: 약 453만원 (연두 선)
- – 0.618: 약 507만원 (청록 선)
- – 0.786: 약 586만원 (하늘 선)
- 상승 채널: 하단~중단 사이 위치
- 일목 구름: 과거 음운 돌파 후 구름 상단~중심부 위에서 거래
- 볼린저밴드: 중심선 살짝 위, 중단 영역
- Stoch RSI(14,14,3,3): %K ≈ 34.5, %D ≈ 25.8 (저점 영역에서 상승 전환 초입)
- 거래량: 최근 주봉 거래량 감소, 고점 구간 대비 낮은 수준
주봉 Stoch RSI는 %K 34.5, %D 25.8로 저점 영역(20~30 구간)에서 위로 꺾이는 초입 단계에 있다. 이는 과매도 구간을 벗어나 상승 모멘텀이 형성될 가능성을 시사하지만, 아직 골든크로스가 확정되지 않은 상태라 단기 반등 신호로 해석하기보다는 “관망 구간 진입” 정도로 볼 수 있다. 주봉 거래량은 최근 봉들이 직전 고점 구간(2025년 중반) 대비 낮아진 상태로, 아직 “폭발적 매수세”는 나타나지 않고 있다.
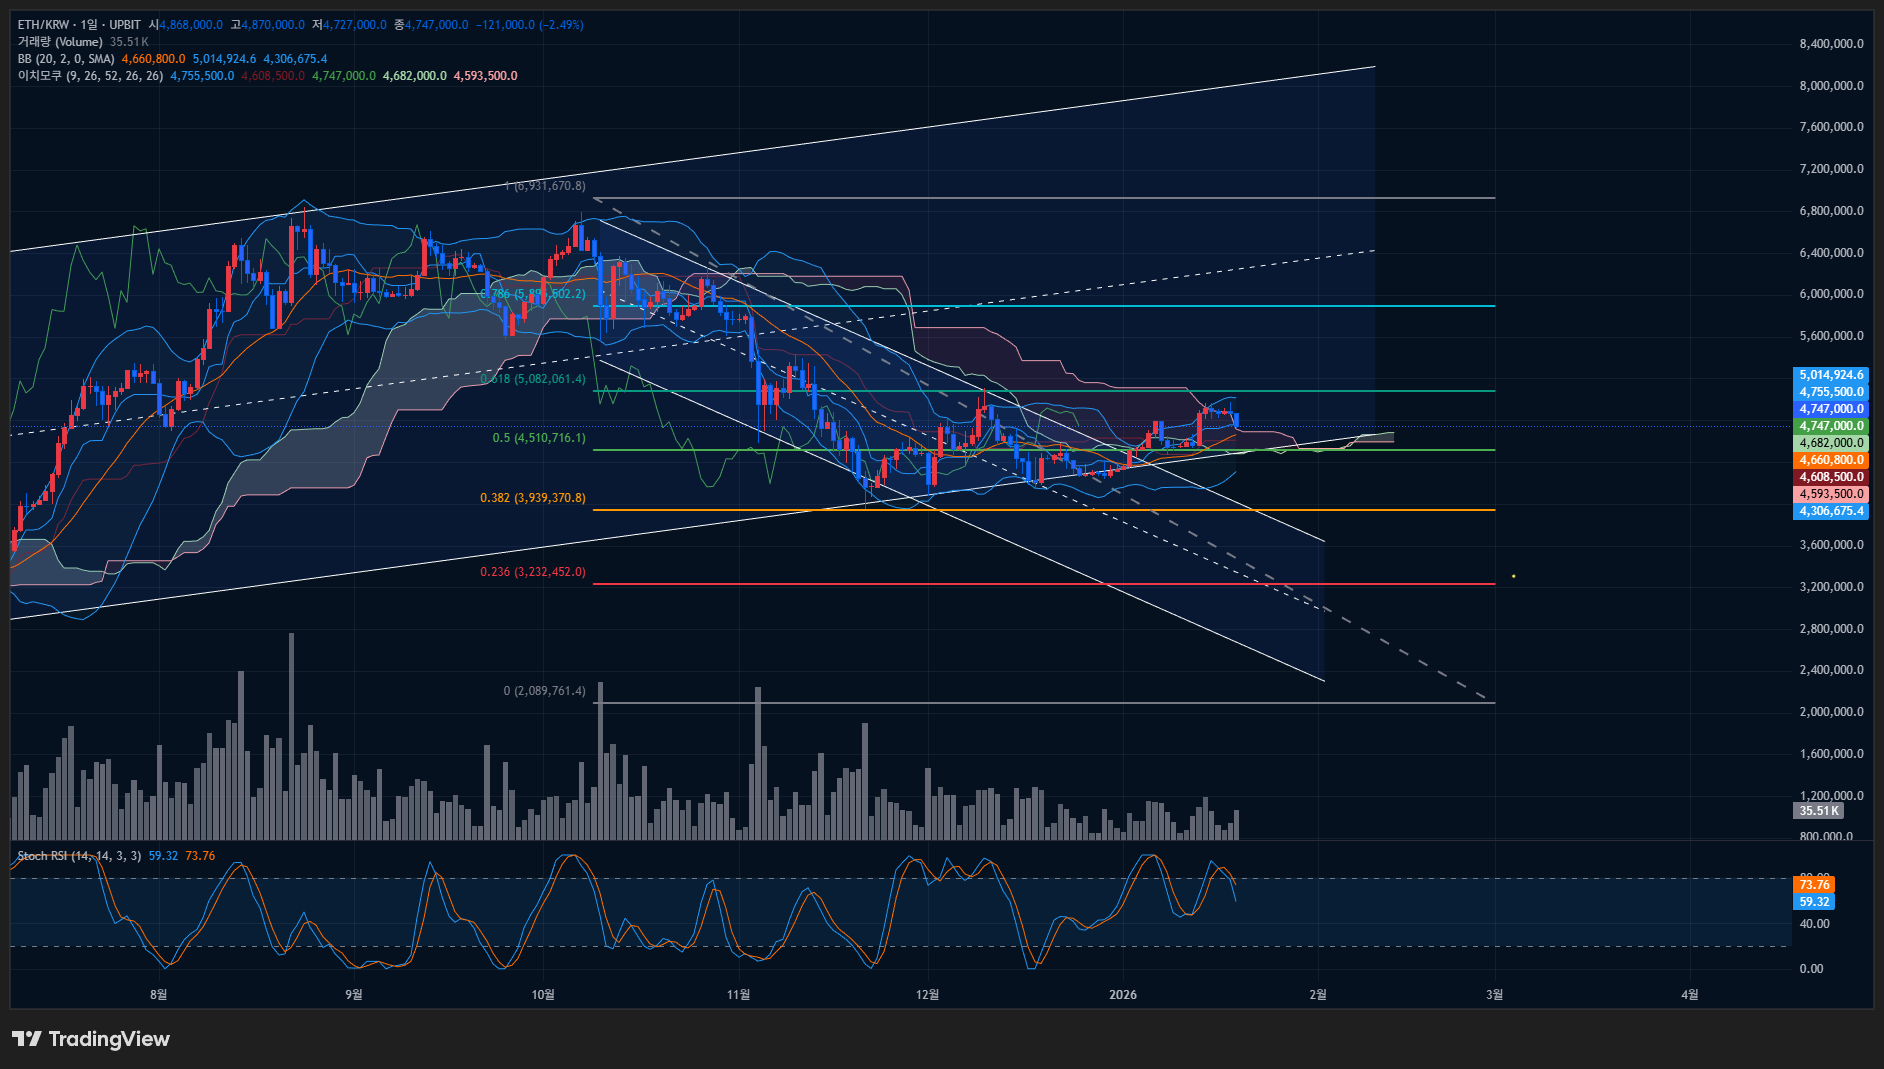
출처: 업비트 일봉챠트 ( 26.01.20)
일봉 기술적 분석: 하락 채널 탈출, Stoch RSI 과열 진입 직전
일봉 차트(2025년 8월~2026년 1월)를 보면, 이더리움은 상단이 살짝 우상향하는 중기 상승 채널 상단에서 이탈한 후 하락 채널 안에서 조정을 거쳤다. 현재는 하락 채널 상단을 돌파해 수평 구간으로 전환된 상태로, 일목 구름을 위로 돌파하며 단기 추세 전환 신호를 보이고 있다.
일봉 주요 지표 (2026년 1월 20일 기준)
- 현재가: 약 4,75만~4,76만원
- 피보나치 리트레이스먼트 (일봉 기준):
- – 0.236: 약 323만원
- – 0.382: 약 399만원
- – 0.5: 약 451만원
- – 0.618: 약 508만원
- – 0.786: 약 586만원
- 현재 위치: 피보 0.5(451만원) 위, 0.618(508만원) 아래 중간 영역
- 하락 채널: 상단 돌파 후 수평 구간 전환
- 일목 구름: 과거 하락 구름 탈출, 현재 얇은 양운 위에서 거래
- 볼린저밴드: 중심선 근처, 중립~약강세 구간
- Stoch RSI(14,14,3,3): %K ≈ 73.7, %D ≈ 59.3 (상단 영역 진입 직전, 아직 데드크로스 아님)
- 거래량: 최근 35.5K, 과거 급락·급등 구간 대비 낮은 에너지 축적 구간
일봉 Stoch RSI는 %K 73.7, %D 59.3으로 과열 구간(80 이상) 진입 직전에 있다. 아직 데드크로스는 발생하지 않았지만, %K가 상단에 근접하고 있어 단기 조정 가능성을 염두에 두어야 한다. 거래량은 35.5K로 과거 급락·급등 구간 대비 낮은 수준이며, 이는 단기 에너지 축적 구간으로 해석할 수 있다. 거래량이 동반 증가하며 508만원(피보 0.618)을 돌파하면 추가 상승 여력이 열리지만, 거래량 없이 상승하면 단기 조정 가능성이 높아진다.
비트코인 의존성과 이더리움 독립 변수
이더리움은 비트코인(BTC)과 높은 상관관계를 보이며, 비트코인이 조정을 받으면 이더리움도 동반 하락하는 경향이 있다. 2026년 1월 현재 비트코인은 10만 달러 부근에서 횡보하고 있으며, 이더리움도 비트코인의 방향성에 영향을 받을 가능성이 크다. 다만 이더리움은 최근 Pectra 업그레이드(2025년 3월 예정), 레이어2 확장성 개선, ETF 자금 유입 등 독립 변수가 존재해 비트코인 대비 상대적 강세를 보일 여지도 있다. 투자자는 비트코인 흐름과 이더리움 독립 변수를 함께 모니터링해야 한다.
실전 적용: 475만원 부근 분기점, 508만원 vs 451만원 방향성 주목
현재 이더리움은 일봉·주봉 모두 피보나치 0.5(약 451만~453만원)와 0.618(약 507만~508만원) 사이에 위치해 있어, 단기 방향성의 분기점으로 볼 수 있다. 일봉 Stoch RSI가 과열 구간 진입 직전이고 주봉 Stoch RSI는 저점 영역에서 상승 전환 초입이라, 단기 조정 가능성과 중기 반등 가능성이 교차하는 구간이다.
- 상승 시나리오: 거래량 증가와 함께 508만원(피보 0.618)을 돌파하면, 주봉 상승 채널 중단~상단 구간(550만~586만원)까지 추가 상승 여력이 열린다. 이 경우 일봉 Stoch RSI가 과열 구간에서 데드크로스를 보이더라도 주봉 상승 모멘텀이 우선될 가능성이 있다.
- 하락 시나리오: 거래량 없이 일봉 Stoch RSI가 데드크로스를 보이며 451만원(피보 0.5)을 하회하면, 주봉 상승 채널 하단(약 440만~450만원) 또는 피보 0.382(약 399만원)까지 조정 가능성이 있다. 이 경우 주봉 Stoch RSI가 골든크로스를 형성하지 못하고 다시 하락 전환할 위험이 있다.
실전 적용 관점에서는 508만원 돌파 여부와 거래량 증가 여부를 핵심 변수로 모니터링하는 것이 중요하다. 단기 트레이더라면 일봉 Stoch RSI 데드크로스 신호에 주의하고, 중기 투자자라면 주봉 상승 채널 하단(440만~450만원) 지지 여부를 중점적으로 봐야 한다.
시장 대응 시나리오
주봉 Stoch RSI가 저점 영역(34.5)에서 상승 전환 신호를 보이고 있으며, 일목 구름을 돌파하고 상승 채널 하단으로 복귀하면서 중기 추세 전환 가능성이 열리고 있다. 현재 피보나치 0.5(453만원)와 0.618(507만원) 사이에 위치해 있어, 거래량 증가와 함께 508만원을 돌파하면 주봉 상승 채널 중단~상단 구간(550만~586만원)까지 추가 상승 여력이 있다.
펀더멘털 측면에서 이더리움은 2025년 3월 예정인 Pectra 업그레이드(스테이킹 인출 개선, 계정 추상화 등), 레이어2 확장성 개선(Optimism, Arbitrum 등 거래량 증가), 미국 이더리움 현물 ETF 자금 유입 확대 등 긍정적 변수가 존재한다. 특히 2026년 상반기 DeFi 생태계 회복과 NFT 거래량 증가가 맞물리면, 이더리움은 비트코인 대비 상대적 강세를 보일 가능성이 있다.
일봉 Stoch RSI가 과열 구간 진입 직전(73.7)이지만, 아직 데드크로스는 발생하지 않았고 주봉 모멘텀이 강화되고 있어 단기 조정을 거쳐도 중기 상승 추세가 이어질 가능성이 있다. 거래량이 동반 증가하며 508만원을 돌파하고, 일봉·주봉 Stoch RSI가 모두 골든크로스를 형성하면 550만~586만원 구간까지 랠리가 이어질 수 있다.
한국 시장에서는 이더리움이 업비트·빗썸 등 주요 거래소에서 김치 프리미엄(해외 대비 가격 프리미엄)이 형성되는 경향이 있어, 글로벌 시장 대비 상대적 강세를 보일 가능성도 있다. 특히 한국 투자자들의 알트코인 선호도가 높아 비트코인 횡보 구간에서 이더리움으로 자금이 이동할 여지가 있다.
일봉 Stoch RSI가 73.7로 과열 구간 진입 직전에 있으며, %K가 상단에 근접하고 있어 단기 데드크로스 가능성이 있다. 거래량이 35.5K로 과거 급등 구간 대비 낮은 수준이어서, 거래량 증가 없이 상승하면 단기 조정 가능성이 높아진다. 451만원(피보 0.5)을 하회하면 주봉 상승 채널 하단(440만~450만원) 또는 피보 0.382(399만원)까지 조정 가능성이 있다.
주봉 Stoch RSI가 34.5로 저점 영역에서 상승 전환 신호를 보이고 있지만, 아직 골든크로스가 확정되지 않은 상태다. 주봉 거래량도 최근 봉들이 직전 고점 구간 대비 낮아진 상태로, 중기 매수세가 약화되고 있음을 시사한다. 주봉 Stoch RSI가 골든크로스를 형성하지 못하고 다시 하락 전환하면, 상승 채널 하단 이탈 가능성도 배제할 수 없다.
비트코인 의존성도 주요 리스크 요인이다. 2026년 1월 현재 비트코인은 10만 달러 부근에서 횡보하고 있으며, 만약 비트코인이 9만 달러 이하로 조정을 받으면 이더리움도 동반 하락할 가능성이 크다. 이 경우 이더리움은 399만원(피보 0.382) 또는 330만원(피보 0.236)까지 하락 폭이 확대될 수 있다.
펀더멘털 측면에서도 리스크가 존재한다. 이더리움은 레이어2 확장성 개선으로 메인넷 수수료 수익이 감소하고 있으며, 이는 ETH 소각량(burn rate) 감소로 이어져 장기 공급 압력으로 작용할 수 있다. 또한 2026년 상반기 미국 SEC(증권거래위원회)의 암호화폐 규제 강화 또는 이더리움 현물 ETF 자금 유출 가속화가 발생하면, 이더리움은 추가 조정 압력을 받을 수 있다.
English Summary (click to expand)
📊 Ethereum (ETH) Overview
Ethereum (ETH) is the world’s first general-purpose blockchain platform supporting smart contracts, developed by Vitalik Buterin and launched in 2015. While Bitcoin is often described as “digital gold,” Ethereum is positioned as the “operating system of the digital economy,” serving as the foundation for DeFi (Decentralized Finance), NFTs (Non-Fungible Tokens), metaverse applications, and more. Ethereum transitioned from Proof-of-Work (PoW) to Proof-of-Stake (PoS) via “The Merge” in September 2022, reducing energy consumption by 99.95%. The platform continues to evolve with Layer 2 scaling solutions (Optimism, Arbitrum, zkSync) aimed at increasing transaction speed and reducing fees.
📈 Weekly Chart Analysis (Medium-to-Long-term View)
As of January 20, 2026, Ethereum (ETH/KRW) is trading around ₩4.75 million, positioned between Fibonacci retracement levels 0.5 (₩4.53 million) and 0.618 (₩5.07 million) based on the swing low of ₩2.206 million and swing high of ₩6.846 million. The weekly chart shows Ethereum has returned to the lower-to-mid range of an ascending channel that originated from the 2025 low. After briefly breaking below the channel’s lower boundary, ETH has reclaimed this support zone, suggesting potential for medium-term trend reversal.
Key Weekly Indicators:
(1) Fibonacci Levels: Current price sits above the 0.5 retracement (₩4.53M) but below 0.618 (₩5.07M). A break above ₩5.08M with volume confirmation would open the door to the 0.786 level (₩5.86M) and potentially retest the channel’s upper boundary (₩6.4M-₩6.8M range).
(2) Stochastic RSI (14,14,3,3): %K ≈ 34.5, %D ≈ 25.8, indicating Stoch RSI is emerging from the oversold zone (20-30 range) and showing early signs of a bullish crossover. However, the golden cross has not yet confirmed, suggesting investors should monitor for sustained momentum before committing to long positions.
(3) Ichimoku Cloud: Price has broken above the bearish cloud (kumo) from prior weeks and is now trading above the cloud’s upper boundary, indicating a potential shift from bearish to neutral/bullish medium-term structure.
(4) Bollinger Bands: Price is slightly above the middle band, positioned in the mid-range between upper and lower bands, suggesting neither overbought nor oversold conditions on the weekly timeframe.
(5) Volume: Recent weekly volume bars have declined compared to the high-volume weeks during the mid-2025 rally. This subdued volume suggests a period of consolidation or energy accumulation, with no explosive buying pressure yet evident. A volume surge accompanying a breakout above ₩5.08M would be a strong confirmation signal.
📊 Daily Chart Analysis (Short-term View)
The daily chart (August 2025 to January 2026) reveals that Ethereum has broken above the upper boundary of a descending channel and transitioned into a horizontal consolidation zone. The price has reclaimed the Ichimoku cloud from below, signaling a potential short-term trend reversal. However, short-term overbought signals warrant caution.
Key Daily Indicators:
(1) Fibonacci Levels (Daily Basis): 0.5 retracement at ₩4.51M, 0.618 at ₩5.08M. Current price (₩4.75M-₩4.76M) sits between these two key levels, representing a critical decision zone for short-term direction.
(2) Descending Channel Breakout: Ethereum has broken above the upper boundary of the descending channel that had constrained price action since mid-2025. This breakout suggests a shift from downtrend to consolidation/potential uptrend.
(3) Stochastic RSI (14,14,3,3): %K ≈ 73.7, %D ≈ 59.3, indicating Stoch RSI is approaching the overbought zone (80+) but has not yet crossed into extreme territory. A bearish crossover (death cross) has not occurred, but %K is nearing the upper threshold, suggesting short-term correction risk if volume does not support further gains.
(4) Ichimoku Cloud: Price has broken above the bearish cloud and is now trading above a thin bullish cloud, indicating short-term bullish structure. The cloud is thin, suggesting the trend is not yet strongly established.
(5) Bollinger Bands: Price is near the middle band, trading in a neutral-to-slightly-bullish range between the upper and lower bands.
(6) Volume: Recent daily volume is approximately 35.5K, significantly lower than the volume spikes seen during sharp rallies and selloffs in late 2025. This low volume suggests an energy accumulation phase rather than sustained buying pressure. A breakout above ₩5.08M without volume confirmation would raise concerns about the sustainability of the move.
📈 Bullish Scenario
If Ethereum breaks above ₩5.08 million (Fibonacci 0.618) with increasing volume, the path opens toward the ₩5.5M-₩5.86M range (Fibonacci 0.786 and mid-to-upper ascending channel zone). The weekly Stochastic RSI is emerging from the oversold zone and showing early signs of a bullish crossover, while the daily Stoch RSI has not yet entered extreme overbought territory or triggered a bearish crossover. If both daily and weekly Stoch RSI confirm golden crosses with volume support, Ethereum could sustain a rally toward ₩5.5M-₩5.86M in the coming weeks.
From a fundamental perspective, Ethereum has several positive catalysts on the horizon: (1) Pectra Upgrade (March 2025): Expected to improve staking withdrawals, account abstraction, and overall network efficiency. (2) Layer 2 Expansion: Growing transaction volumes on Optimism, Arbitrum, and zkSync suggest increasing demand for Ethereum’s ecosystem despite lower mainnet fees. (3) U.S. Spot ETH ETF Inflows: If institutional demand accelerates via spot ETF products, Ethereum could see sustained buying pressure independent of Bitcoin’s movements. (4) DeFi and NFT Recovery: A resurgence in DeFi protocol activity and NFT trading volumes in H1 2026 could drive increased demand for ETH as gas fees and collateral.
In the Korean market, Ethereum often trades at a “kimchi premium” (price premium vs. global exchanges) on Upbit and Bithumb, particularly during bullish momentum periods. If Korean retail investors rotate capital from Bitcoin into Ethereum during BTC’s consolidation phase, ETH/KRW could outperform global ETH/USD pairs, amplifying upside potential toward ₩5.86M-₩6.0M.
📉 Bearish Scenario
The daily Stochastic RSI is at 73.7, approaching the overbought threshold (80+), and %K is nearing levels where bearish crossovers (death crosses) historically occur. If a death cross forms without volume support, Ethereum could correct toward ₩4.51M (Fibonacci 0.5) or ₩4.4M-₩4.5M (ascending channel lower boundary). A break below ₩4.51M would expose the ₩3.99M level (Fibonacci 0.382) as the next support zone.
The weekly Stochastic RSI is at 34.5, showing early signs of a bullish crossover but not yet confirmed. If the weekly Stoch RSI fails to sustain upward momentum and rolls over, the bullish case weakens significantly. Weekly volume has declined compared to the mid-2025 rally, suggesting waning medium-term buying interest. If the weekly Stoch RSI fails to confirm a golden cross and reverses downward, Ethereum could retest the ascending channel’s lower boundary (₩4.4M-₩4.5M) or even break below the channel entirely, targeting ₩3.99M-₩3.30M.
Bitcoin Correlation Risk: Ethereum maintains a high correlation with Bitcoin (BTC), and if BTC corrects below $90,000, Ethereum is likely to experience sympathy selling. As of January 2026, Bitcoin is consolidating around $100,000, and a breakdown below key support levels would trigger broader altcoin weakness, including Ethereum. In this scenario, ETH/KRW could fall to ₩3.99M (Fibonacci 0.382) or ₩3.30M (Fibonacci 0.236), erasing recent gains.
Fundamental Headwinds: Ethereum faces structural challenges as Layer 2 adoption grows. While L2 scaling solutions improve user experience, they also reduce mainnet transaction fees, leading to lower ETH burn rates (deflationary mechanism). Lower burn rates mean reduced deflationary pressure on ETH supply, potentially capping long-term price appreciation. Additionally, if the U.S. SEC intensifies crypto regulation or if spot ETH ETF outflows accelerate in H1 2026, Ethereum could face sustained selling pressure.
🎯 Key Takeaway
Ethereum (ETH/KRW) is currently at a critical inflection point, trading between Fibonacci 0.5 (₩4.53M) and 0.618 (₩5.08M) on both daily and weekly charts. The weekly Stoch RSI is emerging from the oversold zone, suggesting potential for a medium-term reversal, while the daily Stoch RSI is approaching overbought territory, indicating short-term correction risk. The key levels to watch are: (1) ₩5.08M (Fibonacci 0.618): A breakout above this level with volume confirmation would open the path to ₩5.5M-₩5.86M. (2) ₩4.51M (Fibonacci 0.5): A breakdown below this level would expose ₩4.4M-₩4.5M (channel support) and ₩3.99M (Fibonacci 0.382). Investors should monitor volume trends, Stochastic RSI crossovers, and Bitcoin’s price action closely. Long-term holders may view current levels as a medium-term accumulation zone based on weekly chart strength, while short-term traders should exercise caution given daily overbought signals and low volume conditions. Risk management through position sizing and stop-loss orders is essential. This analysis does not constitute investment advice, and all investment decisions remain the responsibility of individual investors.
형의 관점
형이 보기에 이더리움은 지금 중기 반등 가능성과 단기 조정 가능성이 교차하는 분기점에 놓여 있어. 주봉 Stoch RSI가 저점 영역에서 상승 전환 신호를 보이고 있고, 상승 채널 하단으로 복귀하며 중기 추세 전환 가능성이 열리고 있어. 다만 일봉 Stoch RSI가 73.7로 과열 구간 진입 직전이라, 단기적으로는 조정 가능성을 염두에 둬야 해.
핵심은 508만원(피보 0.618) 돌파 여부와 거래량 증가 여부야. 거래량이 동반 증가하며 508만원을 돌파하면 550만~586만원 구간까지 추가 상승 여력이 있고, 반대로 거래량 없이 일봉 Stoch RSI가 데드크로스를 보이며 451만원을 하회하면 주봉 상승 채널 하단(440만~450만원) 또는 399만원까지 조정 가능성이 있어.
비트코인 흐름도 중요해. 이더리움은 비트코인과 높은 상관관계를 보여서, 비트코인이 10만 달러 부근에서 횡보하는 동안은 이더리움도 475만원 부근에서 방향성을 모색할 가능성이 크거든. 만약 비트코인이 9만 달러 이하로 조정을 받으면 이더리움도 동반 하락할 위험이 있어. 단기 트레이더라면 일봉 Stoch RSI 데드크로스 신호에 주의하고, 중기 투자자라면 주봉 상승 채널 하단 지지 여부를 중점적으로 봐야 해.
참고 출처
- 제공된 차트 이미지 출처 : 업비트 (ETH/KRW 일봉·주봉 차트)
- 기술적 지표 분석: 피보나치 리트레이스먼트, 일목 구름, 볼린저밴드, Stoch RSI, 거래량
- Wikipedia: Ethereum


