

- 피보나치 되돌림은 13세기 수학자 레오나르도 피보나치가 발견한 수열(1, 1, 2, 3, 5, 8, 13…)을 기반으로, 인접한 두 수의 비율이 약 1.618(황금비)로 수렴하는 원리를 주가 분석에 적용한 것이다.
- 주요 되돌림 비율은 23.6%(0.236), 38.2%(0.382), 50%(0.5), 61.8%(0.618), 78.6%(0.786)이며, 상승 추세에서는 조정 시 지지선으로, 하락 추세에서는 반등 시 저항선으로 작용할 가능성이 있다.
- 피보나치는 “절대 법칙”이 아니라 “확률적 참고 도구”이므로, 거래량·이동평균선·RSI 등 다른 지표와 함께 사용하고 리스크 관리 기준을 설정하는 것이 중요하다.
피보나치 되돌림이란? — 황금비로 시장을 읽는 법
피보나치 되돌림(Fibonacci Retracement)은 13세기 이탈리아 수학자 레오나르도 피보나치(Leonardo Fibonacci)가 발견한 피보나치 수열을 주가 분석에 적용한 기술적 분석 도구다. 피보나치 수열은 1, 1, 2, 3, 5, 8, 13, 21, 34, 55, 89… 처럼 앞의 두 수를 더하면 다음 수가 되는 규칙을 따르며, 인접한 두 수의 비율(예: 55÷89 ≈ 0.618, 89÷55 ≈ 1.618)은 약 1.618로 수렴한다. 이 비율을 “황금비(Golden Ratio)”라고 부르며, 자연·건축·예술에서도 자주 발견되는 조화로운 비율이다.
주식·암호화폐·외환 시장에서 피보나치 되돌림은 과거 고점과 저점 사이를 황금비(0.236, 0.382, 0.5, 0.618, 0.786)로 나눠, 가격이 조정 또는 반등할 때 어느 구간에서 지지·저항을 받을 가능성이 있는지를 예측하는 데 사용된다. 예를 들어, 주가가 100만원에서 200만원까지 상승한 뒤 조정을 받으면, 피보나치 0.618 되돌림 구간인 약 138만원 부근(200만원 – (100만원 × 0.618) = 138.2만원)이 지지선으로 작용할 가능성이 있다는 식이다.
피보나치 되돌림 주요 비율
- 23.6% (0.236): 가장 얕은 되돌림 구간. 강한 추세에서 소폭 조정 시 지지·저항으로 작용할 가능성이 있다.
- 38.2% (0.382): 중간 정도의 되돌림 구간. 일반적인 추세 조정에서 자주 관찰되는 지지·저항 구간이다.
- 50% (0.5): 피보나치 수열에서 직접 유도되지는 않지만, 심리적으로 “절반” 지점이라 많은 투자자가 주목하는 구간이다.
- 61.8% (0.618): “황금비” 되돌림 구간. 피보나치에서 가장 중요한 비율로, 강력한 지지·저항으로 작용할 가능성이 있다.
- 78.6% (0.786): 깊은 되돌림 구간. 이 구간까지 조정이 오면 추세 전환 가능성을 염두에 두어야 한다.
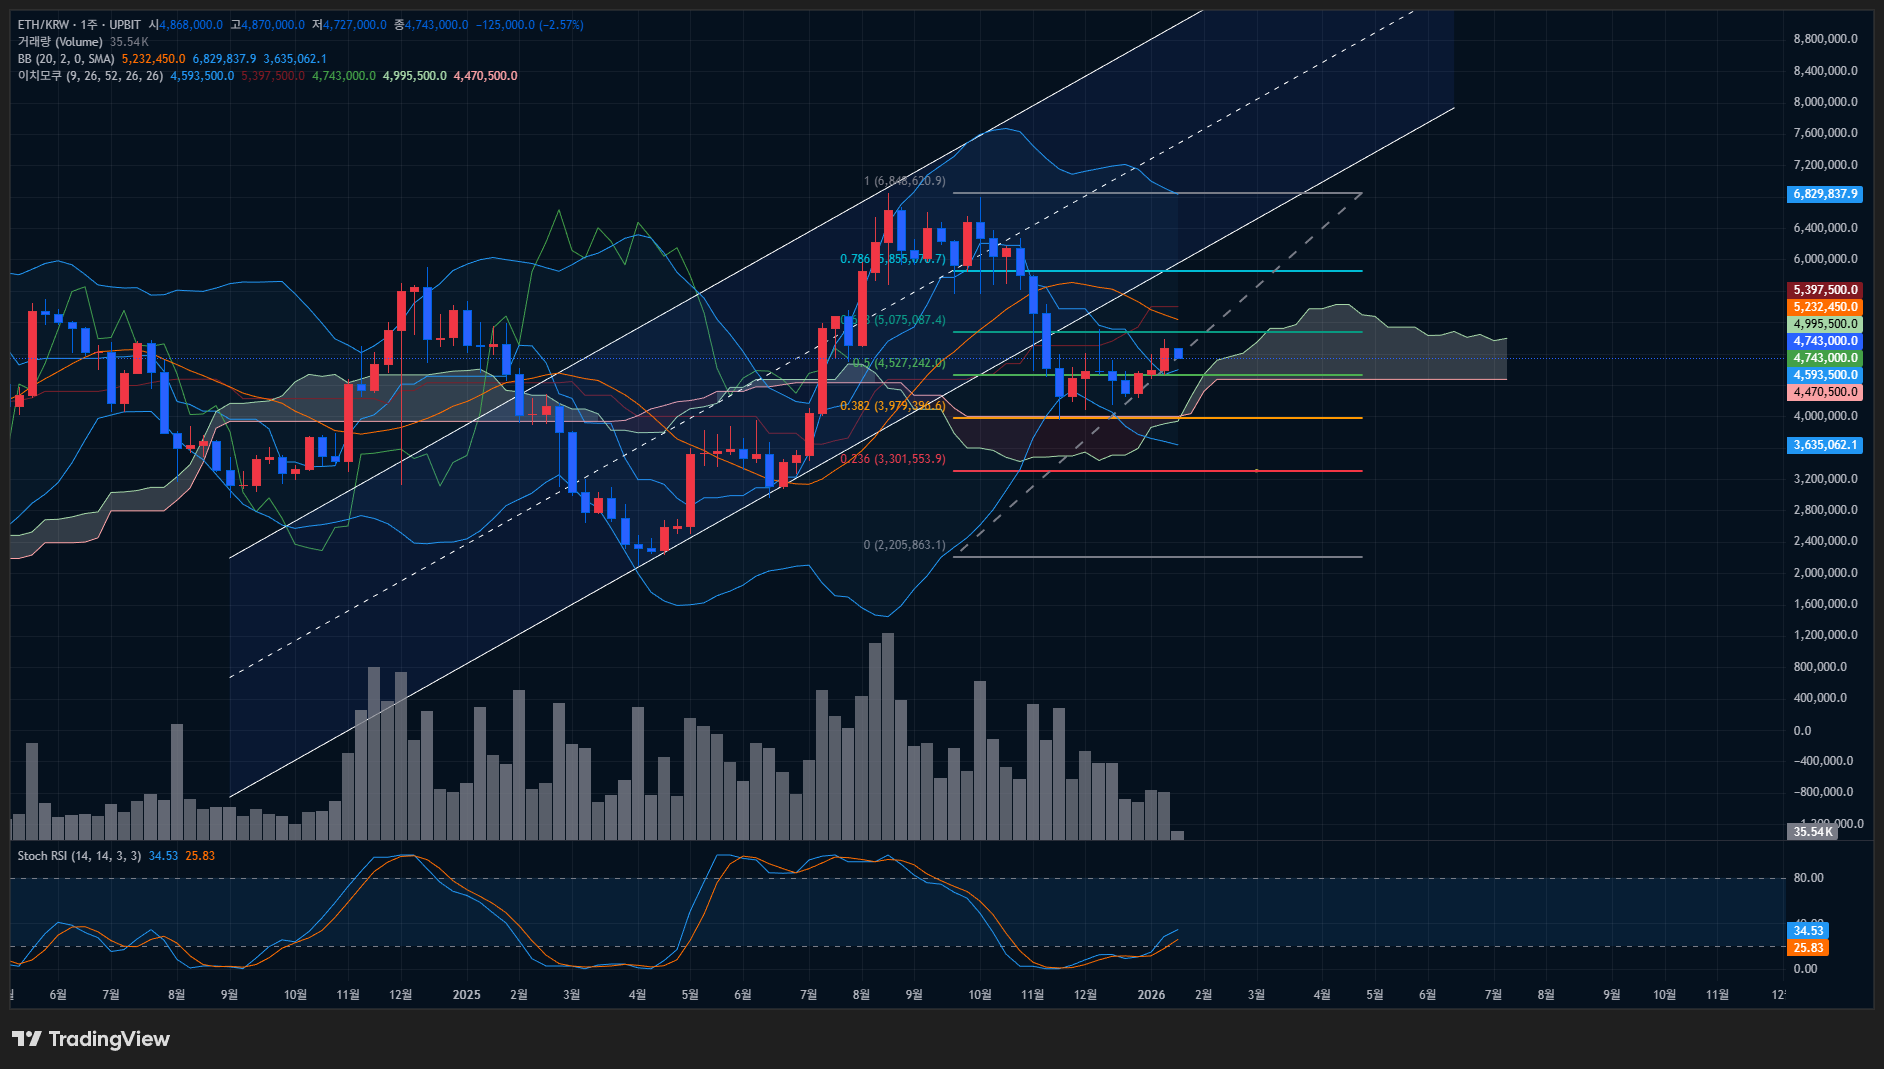
출처: 업비트 주봉챠트 (26.01.20)
피보나치 되돌림 그리는 법 — 3단계로 쉽게 이해하기
피보나치 되돌림을 그리는 방법은 간단하다. 대부분의 차트 플랫폼(트레이딩뷰, 업비트, 빗썸 등)에서 피보나치 되돌림 도구를 제공하며, 아래 3단계만 따라하면 된다.
피보나치 되돌림 그리기 3단계
1단계: 최근 저점과 고점을 찾는다. 상승 추세라면 “저점 → 고점”, 하락 추세라면 “고점 → 저점” 순서로 선을 긋는다.
2단계: 차트 플랫폼에서 피보나치 되돌림 도구를 선택하고, 저점(또는 고점)에서 시작해 고점(또는 저점)까지 드래그한다.
3단계: 자동으로 생성된 수평선(0.236, 0.382, 0.5, 0.618, 0.786)을 확인하고, 현재 가격이 어느 구간에 위치하는지 파악한다.
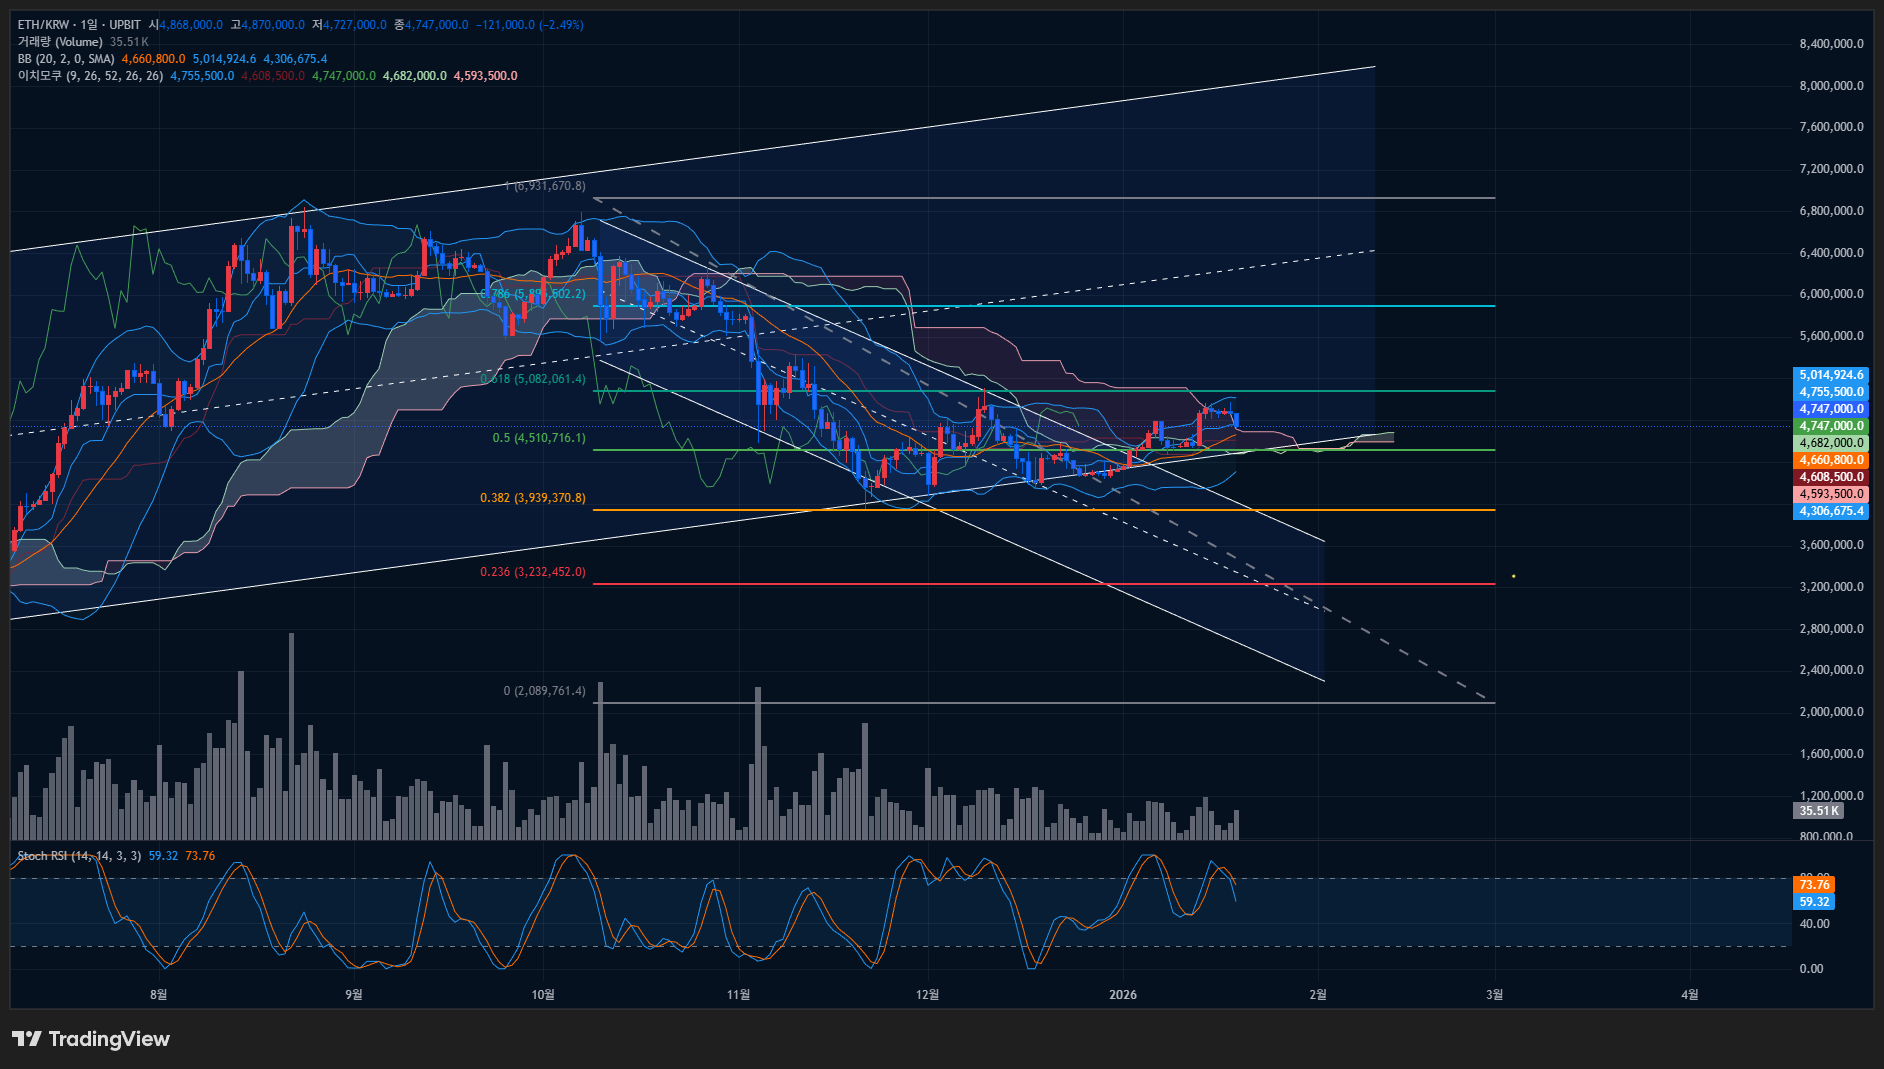
출처: 업비트 일봉챠트 (26.01.20)
실전 사례: 이더리움(ETH/KRW) 피보나치 되돌림 분석
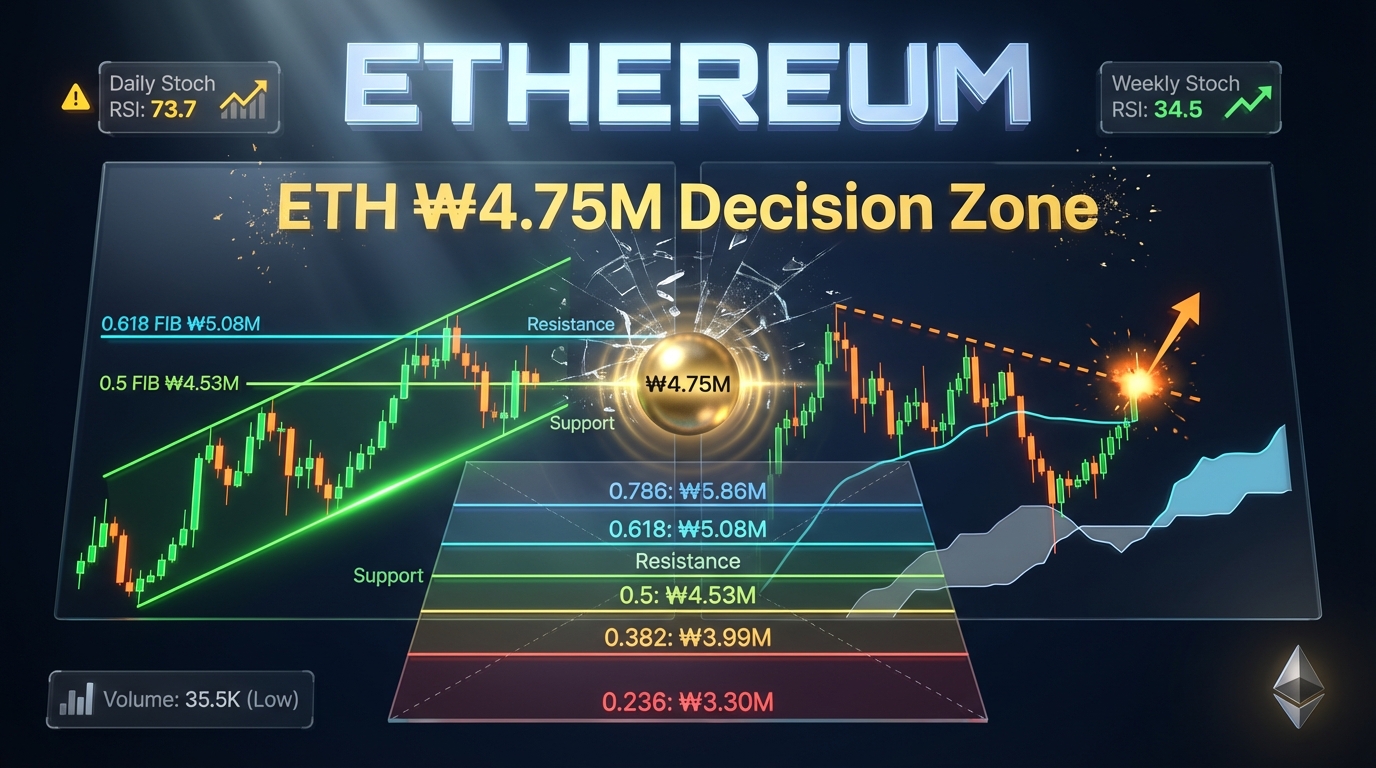
제공된 이더리움(ETH/KRW) 차트를 예시로 피보나치 되돌림을 실전 적용해 보자. 이더리움은 2025년 저점(약 220만원)에서 고점(약 684만원)까지 상승한 뒤 조정을 거쳐 현재(2026년 1월 20일 기준) 약 475만원 부근에서 거래되고 있다.
- 저점 → 고점 설정: 저점 2,205,863원(220만원) → 고점 6,846,320원(684만원)으로 피보나치 되돌림을 그리면, 아래와 같은 주요 되돌림 구간이 나온다.
- 피보나치 0.236 (23.6%): 약 330만원. 가장 얕은 되돌림 구간으로, 현재 가격(475만원)은 이 구간을 상회하고 있다.
- 피보나치 0.382 (38.2%): 약 399만원. 중간 정도의 되돌림 구간으로, 이더리움은 이 구간도 상회하고 있다.
- 피보나치 0.5 (50%): 약 453만원. 심리적 “절반” 지점으로, 현재 가격(475만원)은 이 구간 바로 위에 위치해 있다.
- 피보나치 0.618 (61.8%): 약 507만원. 황금비 되돌림 구간으로, 현재 가격은 이 구간 아래에 있다. 만약 가격이 507만원을 돌파하면 추가 상승 여력이 열릴 가능성이 있다.
- 피보나치 0.786 (78.6%): 약 586만원. 깊은 되돌림 구간으로, 이 구간까지 조정이 오면 추세 전환 가능성을 염두에 두어야 한다.
현재 이더리움은 피보나치 0.5(453만원)와 0.618(507만원) 사이에 위치해 있어, 단기 방향성의 분기점으로 볼 수 있다. 거래량 증가와 함께 507만원(0.618)을 돌파하면 추가 상승 여력이 열리고, 반대로 453만원(0.5)을 하회하면 399만원(0.382) 또는 330만원(0.236)까지 조정 가능성이 있다.
피보나치 되돌림 활용법 4가지
피보나치 되돌림을 실전에서 활용하는 방법은 다양하다. 아래 4가지 활용법을 숙지하면 투자 판단에 도움이 될 수 있다.
- (1) 지지·저항 구간 예측
→ 상승 추세에서 조정이 오면 피보나치 되돌림 구간(0.382, 0.5, 0.618)이 지지선으로 작용할 가능성이 있다. 반대로 하락 추세에서 반등이 오면 같은 구간이 저항선으로 작용할 가능성이 있다. 예를 들어, 이더리움이 684만원에서 조정을 받으면 507만원(0.618) 또는 453만원(0.5) 부근에서 지지를 받을 가능성을 염두에 둘 수 있다. - (2) 진입·청산 타이밍 참고
→ 피보나치 되돌림 구간을 매수·매도 타이밍의 참고 지표로 활용할 수 있다. 예를 들어, 가격이 0.618 구간에서 지지를 받고 반등하면 매수 신호로 해석할 수 있고, 반대로 0.618 구간을 하회하면 손절 신호로 해석할 수 있다. 다만 피보나치만으로 판단하지 말고, 거래량·이동평균선·RSI 등 다른 지표와 함께 사용해야 한다. - (3) 목표가 설정
→ 피보나치 확장(Fibonacci Extension)을 사용하면 상승 목표가를 예측할 수 있다. 예를 들어, 저점에서 고점까지 상승한 뒤 조정을 거쳐 다시 상승하면, 피보나치 1.618(161.8%) 또는 2.618(261.8%) 확장 구간이 목표가로 작용할 가능성이 있다. 이더리움의 경우 684만원 고점을 돌파하면 피보나치 확장 1.618 구간인 약 860만원이 목표가로 설정될 수 있다. - (4) 다른 지표와 결합
→ 피보나치는 단독으로 사용하기보다 이동평균선, 볼린저밴드, RSI, MACD 등 다른 지표와 결합하면 신뢰도가 높아진다. 예를 들어, 가격이 피보나치 0.618 구간에서 지지를 받으면서 동시에 20일 이동평균선도 지지선으로 작용하고, RSI가 과매도 구간(30 이하)에서 반등하면 매수 신호의 신뢰도가 높아진다.
피보나치 되돌림은 “절대 법칙”이 아니라 “확률적 참고 도구”다. 시장은 항상 피보나치 되돌림 구간에서 반응하는 것이 아니며, 때로는 구간을 무시하고 급락·급등하기도 한다. 따라서 피보나치만 믿고 투자하지 말고, 리스크 관리 기준(손절선, 분할 매수·매도 등)을 반드시 설정해야 한다.
시장 대응 시나리오
피보나치 되돌림은 명확한 추세(상승 또는 하락)가 형성된 후 조정이 올 때 가장 효과적으로 작동할 가능성이 있다. 예를 들어, 이더리움이 220만원에서 684만원까지 명확한 상승 추세를 형성한 뒤 조정을 받으면, 피보나치 0.618(507만원) 또는 0.5(453만원) 구간에서 지지를 받을 가능성이 크다. 이 경우 거래량 증가와 함께 지지 구간에서 반등하면, 피보나치 되돌림이 효과적으로 작동했다고 볼 수 있다.
또한 피보나치 되돌림 구간과 다른 기술적 지표(이동평균선, 볼린저밴드, RSI 등)가 겹치면 신뢰도가 높아진다. 예를 들어, 피보나치 0.618 구간(507만원)과 20주 이동평균선이 겹치고, 주봉 RSI가 과매도 구간에서 반등하면, 이 구간이 강력한 지지선으로 작용할 가능성이 높아진다. 이 경우 투자자는 507만원 부근을 매수 타이밍으로 고려할 수 있다.
피보나치 확장(Fibonacci Extension)을 사용하면 목표가 설정도 가능하다. 이더리움이 507만원에서 지지를 받고 다시 상승하면, 피보나치 1.618 확장 구간인 약 860만원이 목표가로 설정될 수 있다. 이 경우 투자자는 860만원 부근에서 일부 차익 실현을 고려할 수 있다.
심리적 측면에서도 피보나치 되돌림은 의미가 있다. 많은 투자자가 피보나치를 사용하기 때문에, 특정 되돌림 구간(특히 0.618, 0.5)에서 매수·매도 주문이 몰려 실제로 지지·저항으로 작용하는 “자기실현적 예언(Self-Fulfilling Prophecy)” 효과가 나타날 수 있다.
피보나치 되돌림은 “절대 법칙”이 아니라 “확률적 참고 도구”이므로, 때로는 구간을 무시하고 급락·급등하기도 한다. 예를 들어, 이더리움이 피보나치 0.618(507만원) 구간에서 지지를 받을 것으로 예상했으나, 거래량 없이 빠르게 하회하고 0.5(453만원) 또는 0.382(399만원)까지 조정이 확대될 수 있다. 이 경우 피보나치 되돌림 구간이 지지선으로 작용하지 못한 것이다.
추세가 명확하지 않은 횡보 구간에서는 피보나치 되돌림의 신뢰도가 떨어진다. 예를 들어, 이더리움이 450만~500만원 사이에서 수개월간 횡보하면, 피보나치 되돌림 구간이 의미가 없어진다. 이 경우 투자자는 피보나치보다 지지·저항선, 거래량 프로파일 등 다른 지표를 우선적으로 참고해야 한다.
외부 변수(규제, 해킹, 거시경제 충격 등)가 발생하면 피보나치 되돌림은 무력화될 수 있다. 예를 들어, 미국 SEC가 이더리움을 증권으로 규정하거나, 주요 거래소 해킹 사건이 발생하면 피보나치 되돌림 구간과 무관하게 급락할 수 있다. 이 경우 투자자는 피보나치보다 펀더멘털 리스크를 우선적으로 고려해야 한다.
피보나치 되돌림만 믿고 투자하면 큰 손실을 볼 수 있다. 피보나치는 “참고 도구”일 뿐이므로, 반드시 손절선·분할 매수·매도 등 리스크 관리 기준을 설정해야 한다. 예를 들어, 피보나치 0.618(507만원)에서 매수했다면, 0.5(453만원) 하회 시 손절선을 설정하고, 0.786(586만원) 도달 시 일부 차익 실현을 고려하는 식이다.
English Summary (click to expand)
📊 What is Fibonacci Retracement?
Fibonacci Retracement is a technical analysis tool based on the Fibonacci sequence discovered by 13th-century Italian mathematician Leonardo Fibonacci. The Fibonacci sequence (1, 1, 2, 3, 5, 8, 13, 21, 34, 55, 89…) follows the rule that each number is the sum of the two preceding numbers. The ratio between adjacent numbers (e.g., 55÷89 ≈ 0.618, 89÷55 ≈ 1.618) converges to approximately 1.618, known as the “Golden Ratio.” This ratio appears frequently in nature, architecture, and art as a harmonious proportion.
In stock, cryptocurrency, and forex markets, Fibonacci Retracement divides the distance between a recent high and low using Golden Ratio levels (0.236, 0.382, 0.5, 0.618, 0.786) to predict potential support and resistance zones during price corrections or rebounds. For example, if a stock rises from ₩1,000,000 to ₩2,000,000 and then corrects, the Fibonacci 0.618 retracement level at approximately ₩1,382,000 (₩2,000,000 – (₩1,000,000 × 0.618) = ₩1,382,000) may act as a support level.
📏 Key Fibonacci Retracement Levels
23.6% (0.236): The shallowest retracement level. In strong trends, minor corrections may find support/resistance at this level.
38.2% (0.382): A moderate retracement level commonly observed during typical trend corrections.
50% (0.5): While not directly derived from the Fibonacci sequence, the 50% level is psychologically significant as the “halfway point” and is widely watched by investors.
61.8% (0.618): The “Golden Ratio” retracement level. This is the most important Fibonacci level and may act as a strong support/resistance zone.
78.6% (0.786): A deep retracement level. If price corrects to this level, investors should consider the possibility of a trend reversal.
🛠️ How to Draw Fibonacci Retracement (3 Steps)
Step 1: Identify the recent low and high. For an uptrend, draw from “low → high.” For a downtrend, draw from “high → low.”
Step 2: Select the Fibonacci Retracement tool on your charting platform (TradingView, Upbit, Bithumb, etc.) and drag from the low (or high) to the high (or low).
Step 3: Review the automatically generated horizontal lines (0.236, 0.382, 0.5, 0.618, 0.786) and identify where the current price is positioned relative to these levels.
📈 Real-World Example: Ethereum (ETH/KRW) Fibonacci Analysis
Using the provided Ethereum (ETH/KRW) chart as an example, Ethereum rallied from a low of approximately ₩2,206,000 (₩2.21M) to a high of approximately ₩6,846,000 (₩6.85M), then corrected to around ₩4,750,000 (₩4.75M) as of January 20, 2026. Applying Fibonacci Retracement from the low (₩2.21M) to the high (₩6.85M) yields the following key levels:
Fib 0.236 (23.6%): ~₩3.30M (current price is above this level)
Fib 0.382 (38.2%): ~₩3.99M (current price is above this level)
Fib 0.5 (50%): ~₩4.53M (current price is just above this level)
Fib 0.618 (61.8%): ~₩5.07M (current price is below this level; a breakout above ₩5.07M may open further upside potential)
Fib 0.786 (78.6%): ~₩5.86M (deep retracement zone; if price corrects to this level, consider potential trend reversal)
Ethereum is currently positioned between Fib 0.5 (₩4.53M) and Fib 0.618 (₩5.07M), representing a critical decision zone for short-term direction. A breakout above ₩5.07M with volume confirmation could open the path to further gains, while a breakdown below ₩4.53M may expose ₩3.99M (Fib 0.382) or ₩3.30M (Fib 0.236) as the next support zones.
🔧 4 Ways to Use Fibonacci Retracement
(1) Predicting Support/Resistance Zones: In an uptrend, Fibonacci retracement levels (0.382, 0.5, 0.618) may act as support during corrections. Conversely, in a downtrend, these levels may act as resistance during rebounds. For Ethereum correcting from ₩6.85M, ₩5.07M (Fib 0.618) or ₩4.53M (Fib 0.5) may provide support.
(2) Entry/Exit Timing Reference: Fibonacci retracement levels can serve as reference points for buy/sell timing. For example, if price finds support at the 0.618 level and rebounds, it may signal a buy opportunity. Conversely, a breakdown below 0.618 may signal a stop-loss trigger. However, always combine Fibonacci with other indicators (volume, moving averages, RSI) for confirmation.
(3) Setting Price Targets: Fibonacci Extension can be used to project upside targets. If price rallies from a low to a high, corrects, and then resumes the uptrend, Fibonacci Extension levels at 1.618 (161.8%) or 2.618 (261.8%) may serve as potential targets. For Ethereum, if it breaks above ₩6.85M, a Fib 1.618 extension target of ~₩8.60M could be projected.
(4) Combining with Other Indicators: Fibonacci is more reliable when combined with other technical indicators such as moving averages, Bollinger Bands, RSI, and MACD. For example, if price finds support at Fib 0.618 (₩5.07M) while simultaneously holding above the 20-day moving average and RSI rebounds from oversold territory (<30), the buy signal gains credibility.
📈 When Fibonacci Works Well
Fibonacci Retracement tends to work most effectively when there is a clear trend (uptrend or downtrend) followed by a correction. For Ethereum’s rally from ₩2.21M to ₩6.85M, the Fib 0.618 (₩5.07M) or Fib 0.5 (₩4.53M) levels are more likely to act as support during the correction. If the retracement level coincides with other technical indicators (e.g., Fib 0.618 overlapping with the 20-week moving average, or weekly RSI rebounding from oversold), the reliability increases significantly.
Fibonacci Extension can also be used to set price targets. If Ethereum finds support at ₩5.07M and resumes the uptrend, a Fib 1.618 extension target of ~₩8.60M becomes a reasonable projection. Additionally, Fibonacci levels often act as self-fulfilling prophecies because many traders use them, creating concentrated buy/sell orders at key levels (especially 0.618 and 0.5), which can genuinely cause support/resistance to materialize.
📉 When Fibonacci Fails
Fibonacci Retracement is a “probabilistic reference tool,” not an absolute law. Sometimes price ignores Fibonacci levels entirely and experiences sharp moves up or down. For example, Ethereum may be expected to find support at Fib 0.618 (₩5.07M), but if it breaks below without volume support and quickly falls to Fib 0.5 (₩4.53M) or Fib 0.382 (₩3.99M), the Fibonacci level failed to act as support.
In sideways/ranging markets without a clear trend, Fibonacci Retracement becomes less reliable. If Ethereum consolidates between ₩4.5M-₩5.0M for months, Fibonacci levels lose significance. In such cases, traders should prioritize other tools like horizontal support/resistance, volume profile, or range-bound trading strategies.
External shocks (regulatory changes, hacks, macroeconomic events) can override Fibonacci levels. For instance, if the U.S. SEC classifies Ethereum as a security or a major exchange hack occurs, price may plunge regardless of Fibonacci support levels. In such scenarios, fundamental risk management takes precedence over technical analysis.
Relying solely on Fibonacci without risk management can lead to significant losses. Always set stop-losses, use position sizing, and consider partial profit-taking at key levels. For example, if buying at Fib 0.618 (₩5.07M), set a stop-loss below Fib 0.5 (₩4.53M) and consider taking partial profits at Fib 0.786 (₩5.86M) or higher extension targets.
🎯 Key Takeaway
Fibonacci Retracement is a powerful probabilistic tool for identifying potential support/resistance zones based on the Golden Ratio, but it is not a guaranteed predictor of price action. For best results, combine Fibonacci with other technical indicators (moving averages, RSI, MACD, volume), confirm with price action and volume, and always implement risk management strategies (stop-losses, position sizing, partial profit-taking). Fibonacci works best in trending markets with clear directional bias and loses effectiveness in choppy, sideways markets or during external fundamental shocks. Use Fibonacci as one tool in a comprehensive trading toolkit, not as a standalone decision-making system. This analysis does not constitute investment advice, and all investment decisions remain the responsibility of individual investors.
형의 관점
형이 보기에 피보나치 되돌림은 초보자가 배우기에 좋은 기술적 분석 도구야. 차트에 선 몇 개만 그으면 지지·저항 구간을 한눈에 파악할 수 있어서, 투자 판단에 참고하기 편하거든. 특히 0.618(황금비) 구간은 많은 투자자가 주목하는 구간이라, 실제로 지지·저항으로 작용하는 경우가 많아.
다만 피보나치만 믿고 투자하면 큰 코 다칠 수 있어. 피보나치는 “참고 도구”일 뿐이고, 시장은 항상 피보나치 구간에서 반응하는 게 아니야. 특히 횡보 구간이나 외부 충격(규제, 해킹 등)이 있을 때는 피보나치가 무력화될 수 있어. 그래서 피보나치를 사용할 때는 반드시 거래량·이동평균선·RSI 같은 다른 지표와 함께 보고, 손절선·분할 매수·매도 같은 리스크 관리 기준을 꼭 설정해야 해.
이더리움 예시로 보면, 현재 475만원 부근은 피보나치 0.5(453만원)와 0.618(507만원) 사이라 방향성 분기점이야. 거래량 증가와 함께 507만원을 돌파하면 추가 상승 여력이 있고, 반대로 453만원을 하회하면 399만원까지 조정 가능성이 있어. 이럴 때 피보나치를 활용하면 진입·청산 타이밍을 잡는 데 도움이 되지만, 피보나치만 믿지 말고 거래량·RSI 같은 다른 지표도 함께 확인하는 게 중요해.
“`
—
# PART 2 — SEO & 썸네일
**키프레이즈 (공백 구분)**
피보나치 되돌림 Fibonacci Retracement 황금비 0.618 0.5 0.382 지지선 저항선 기술적분석 차트분석 이더리움 ETH
**SEO 제목**
피보나치 되돌림 완벽 가이드 — 황금비로 지지·저항 구간 예측하는 법
**슬러그**
fibonacci-retracement-guide-golden-ratio
**메타 설명**
피보나치 되돌림은 황금비(0.236, 0.382, 0.5, 0.618, 0.786)로 지지·저항 구간을 예측하는 기술적 분석 도구다. 초보자를 위한 그리기 방법, 실전 사례, 활용법 4가지.
**태그 (5~12개)**
피보나치 되돌림, Fibonacci Retracement, 황금비, 0.618, 0.5, 지지선, 저항선, 기술적 분석, 차트 분석, 이더리움, 초보자 교육
—
# 3D 인포그래픽 프롬프트
“`
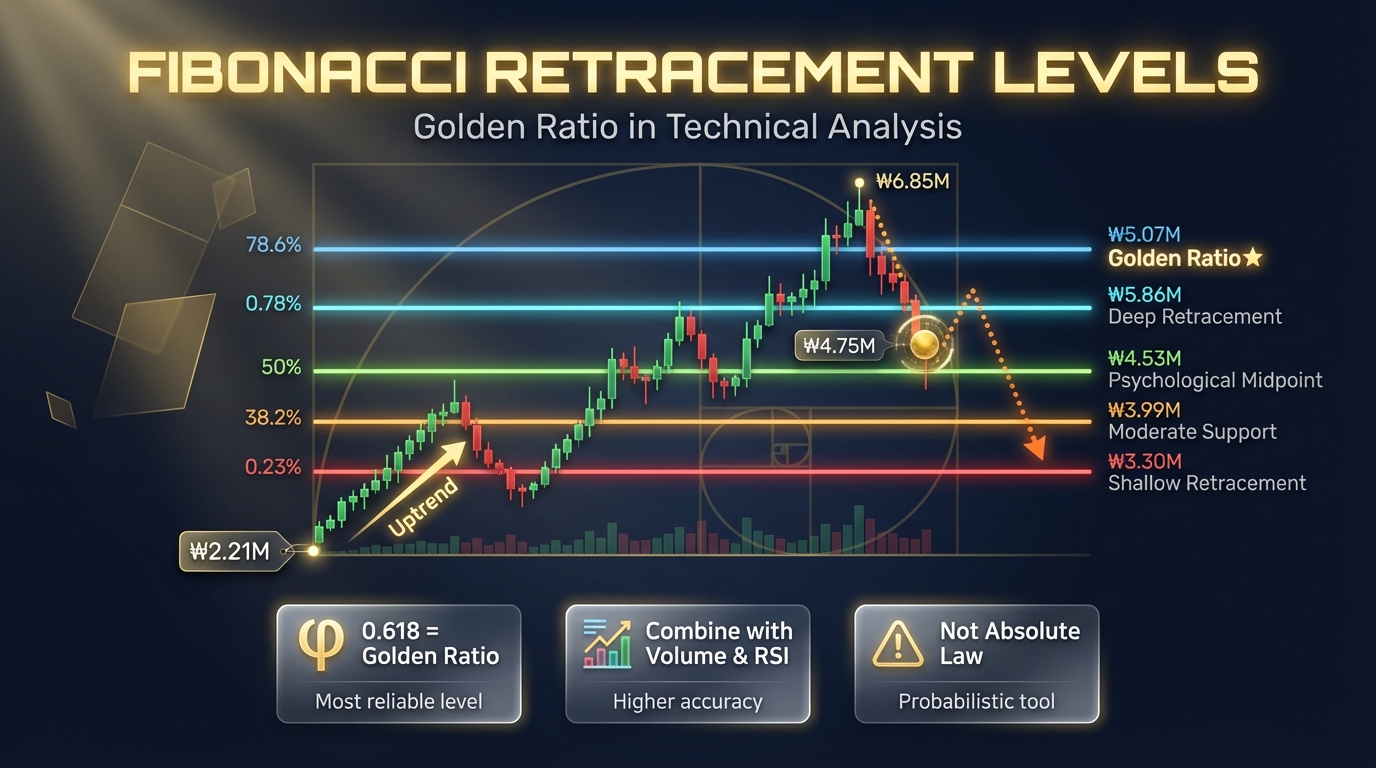
A premium 3D photorealistic infographic explaining Fibonacci Retracement levels for financial education.
Layout: vertical composition, golden ratio aesthetic.
Top section (30%):
– Title: “Fibonacci Retracement Levels” in bold futuristic typography (Orbitron Heavy), glowing golden color
– Subtitle: “Golden Ratio in Technical Analysis” in smaller text
Center section (50%):
– 3D visualization of a price chart showing uptrend from ₩2.21M (bottom-left) to ₩6.85M (top-right) with candlestick pattern
– Five horizontal Fibonacci levels overlaid as glowing neon lines with labels:
* 0.236 (23.6%) – Red line – ₩3.30M – “Shallow Retracement”
* 0.382 (38.2%) – Orange line – ₩3.99M – “Moderate Support”
* 0.5 (50%) – Lime green line – ₩4.53M – “Psychological Midpoint”
* 0.618 (61.8%) – Cyan line – ₩5.07M – “Golden Ratio★”
* 0.786 (78.6%) – Sky blue line – ₩5.86M – “Deep Retracement”
– Current price marker: golden pulsing sphere at ₩4.75M with radiating glow
– Upward green arrow from ₩2.21M to ₩6.85M labeled “Uptrend”
– Downward orange dotted arrow showing correction path with Fibonacci levels
Bottom section (20%):
– Three floating data cards with key insights:
Card 1: “0.618 = Golden Ratio” with phi symbol (φ) – Most reliable level
Card 2: “Combine with Volume & RSI” with chart icon – Higher accuracy
Card 3: “Not Absolute Law” with warning icon – Probabilistic tool
Visual elements:
– Fibonacci spiral (golden spiral) watermark in background, subtle opacity
– Percentage labels next to each level in clean sans-serif font
– Price labels (₩) with comma separators for Korean won format
– Depth of field: sharp focus on 0.618 and 0.5 levels, slight blur on outer levels
– Floating geometric shapes (golden rectangles) in background showing 1.618 ratio
Color palette:
– Background: deep navy gradient (#0a1128 to #1a2332)
– Fibonacci levels: Red (#ff3366), Orange (#ff6b35), Lime (#a3ff00), Cyan (#00ffff), Sky blue (#87ceeb)
– Golden elements: #ffd700 for title, phi symbol, current price marker
– Chart candles: Green bullish (#00ff88), Red bearish (#ff3366)
Lighting:
– Dramatic top-left key light creating volumetric rays
– Rim lighting on Fibonacci level lines for depth
– Soft glow on 0.618 level (Golden Ratio emphasis)
Typography:
– Title: Orbitron Heavy or Eurostile Extended Black
– Labels: Clean geometric sans-serif (DIN, Helvetica Neue)
– All text with subtle drop shadow for legibility
Style references:
– Educational infographic (Khan Academy, Investopedia style)
– Premium financial presentation (Bloomberg, CNBC aesthetics)
– Sci-fi data visualization (minimalist, clean, high-tech)
Technical specs:
– Aspect ratio: 9:16 vertical (optimized for mobile, social media stories)
– Resolution: 1080x1920px
– Render quality: Octane/V-Ray photorealistic 3D
– Professional educational material quality
“`
**간결화 버전 (NanoBanana 최적화):**
“`
Vertical 3D infographic for Fibonacci Retracement education. Top: “Fibonacci Retracement Levels” golden title. Center: uptrend chart ₩2.21M→₩6.85M with 5 glowing horizontal lines: 0.236 red (₩3.30M), 0.382 orange (₩3.99M), 0.5 lime (₩4.53M), 0.618 cyan (₩5.07M “Golden Ratio★”), 0.786 sky blue (₩5.86M). Current price: golden pulsing sphere ₩4.75M. Bottom: 3 data cards “0.618=Golden Ratio”, “Combine with Volume/RSI”, “Not Absolute Law”. Background: Fibonacci spiral watermark, deep navy gradient. Clean educational style, 9:16 vertical, 1080x1920px, photorealistic 3D.
“`
—
# 실사 썸네일 프롬프트
“`
Cinematic photorealistic stock trading desk scene featuring Fibonacci Retracement concept.
Foreground:
– Premium wooden desk with high-end trading setup
– Large ultrawide monitor displaying Ethereum (ETH/KRW) chart with Fibonacci Retracement levels clearly visible
– Chart showing uptrend from ₩2.21M to ₩6.85M with golden ratio levels (0.236, 0.382, 0.5, 0.618, 0.786) overlaid as horizontal lines
– Current price marker at ₩4.75M positioned between 0.5 and 0.618 levels
– Mechanical keyboard with subtle RGB backlighting (blue/cyan tones)
– Wireless mouse with golden accent lighting
– Professional trading notebook with “Fibonacci Strategy” handwritten notes visible
– Coffee cup with steam (depth element)
Midground:
– Secondary monitor showing volume bars and RSI indicator
– Small desk lamp with warm Edison bulb providing ambient lighting
– Succulent plant in minimalist pot (adds life to scene)
– Leather desk mat in dark brown
Background:
– Blurred cityscape through window showing evening/dusk lighting (bokeh effect)
– Soft city lights creating depth
– Dark professional office environment
Screen content (critical):
– Ethereum candlestick chart in green/red colors
– Five clearly visible Fibonacci levels with labels:
* 0.236 – ₩3.30M (red line)
* 0.382 – ₩3.99M (orange line)
* 0.5 – ₩4.53M (lime line)
* 0.618 – ₩5.07M (cyan line, highlighted/thicker)
* 0.786 – ₩5.86M (sky blue line)
– Golden pulsing marker at ₩4.75M (current price)
– Chart title: “ETH/KRW – Fibonacci Analysis”
Overlays (floating holographic style):
– Semi-transparent data card top-left: “Fibonacci Retracement” in bold typography
– Top-right golden badge: “Golden Ratio 0.618★”
– Bottom ticker strip: “ETH ₩4,750,000 | Between 0.5-0.618 Decision Zone”
Lighting:
– Primary light: soft diffused window light from left (blue hour ambiance)
– Secondary light: warm desk lamp from right (creates contrast)
– Monitor glow: cool blue/green reflecting on face/hands (if hands visible in frame)
– Rim lighting on keyboard/mouse edges
– Cinematic three-point lighting setup
Camera:
– Angle: slightly elevated 30-degree angle looking down at desk
– Depth of field: sharp focus on monitor screen, soft blur on background cityscape
– Focal length: 35mm equivalent (natural perspective)
Color grading:
– Overall tone: professional, cool-toned with warm accents
– Monitor: vibrant greens/reds for chart candles, neon Fibonacci lines
– Ambient: blue hour window light (soft blues/purples)
– Accents: warm golden desk lamp, coffee steam
Mood/atmosphere:
– Professional trader analyzing charts
– Focused, analytical, institutional-grade setup
– Evening trading session (after-hours market analysis)
– Clean, organized, premium workspace
Technical specs:
– Aspect ratio: 16:9 landscape
– Resolution: 1920x1080px minimum
– Photography style: Cinematic product photography meets lifestyle commercial
– Reference: Apple product photography, Bloomberg Businessweek editorial, Chase Jarvis studio work
– Render quality: Photoreal, could pass as actual photograph
– No cartoon elements, no excessive post-processing
“`
**간결화 버전:**
“`
Cinematic photo of professional trading desk. Monitor showing ETH/KRW chart with 5 Fibonacci levels (0.236 red ₩3.30M, 0.382 orange ₩3.99M, 0.5 lime ₩4.53M, 0.618 cyan ₩5.07M★, 0.786 blue ₩5.86M). Current price golden marker ₩4.75M. Keyboard, mouse, notebook “Fibonacci Strategy”, coffee cup. Window with city lights background (blurred). Holographic overlay: “Fibonacci Retracement” title, “Golden Ratio 0.618★” badge. Blue hour window light + warm desk lamp. 16:9, 1920x1080px, photorealistic, Bloomberg editorial style.


